Religions: Explore religious groups in the U.S. by tradition, family and denomination
| 1. Alabama | 77% |
| 1. Mississippi | 77% |
| 3. Tennessee | 73% |
| 4. Louisiana | 71% |
| 5. Arkansas | 70% |
| 5. South Carolina | 70% |
| 7. West Virginia | 69% |
| 8. Oklahoma | 66% |
| 8. Georgia | 66% |
| 10. North Carolina | 65% |
| 11. Texas | 64% |
| 11. Utah | 64% |
| 13. Kentucky | 63% |
| 14. Virginia | 61% |
| 15. Missouri | 60% |
| 16. South Dakota | 59% |
| 17. Ohio | 58% |
| 18. New Mexico | 57% |
| 19. Iowa | 55% |
| 19. Kansas | 55% |
| 19. New Jersey | 55% |
| 22. Indiana | 54% |
| 22. Wyoming | 54% |
| 22. Florida | 54% |
| 22. Maryland | 54% |
| 22. Nebraska | 54% |
| 27. Michigan | 53% |
| 27. Pennsylvania | 53% |
| 27. Arizona | 53% |
| 27. District of Columbia | 53% |
| 27. North Dakota | 53% |
| 32. Delaware | 52% |
| 33. Illinois | 51% |
| 33. Idaho | 51% |
| 35. California | 49% |
| 35. Nevada | 49% |
| 35. Minnesota | 49% |
| 35. Rhode Island | 49% |
| 39. Montana | 48% |
| 39. Oregon | 48% |
| 41. Hawaii | 47% |
| 41. Colorado | 47% |
| 43. New York | 46% |
| 44. Washington | 45% |
| 44. Alaska | 45% |
| 44. Wisconsin | 45% |
| 47. Connecticut | 43% |
| 48. Maine | 34% |
| 48. Vermont | 34% |
| 50. New Hampshire | 33% |
| 50. Massachusetts | 33% |
1Protestants no longer make up a majority of U.S. adults. Closely tied to the rise of the religious “nones” is the decline of Christians, including Protestants. The U.S. has a long history as a majority Protestant nation, and, as recently as the 2007 Pew Research Center Religious Landscape Study, more than half of U.S. adults (51.3%) identified as Protestants. But that figure has fallen, and our 2014 study found that 46.5% of Americans are now Protestants.
2Religious switching is a common occurrence in the U.S. Depending on how “religious switching” is defined, as many as 42% of U.S. adults have switched religions. That definition counts switching between Protestant traditions, but even if Protestantism is regarded as a single group, about a third of Americans (34%) identify with a different religious group than the one in which they were raised.
3There is a wide range of racial and ethnic diversity among U.S. religious groups and denominations. Seventh-day Adventists, Muslims and Jehovah’s Witnesses are among the most racially and ethnically diverse U.S. religious groups. The least diverse are the National Baptist Convention, the Evangelical Lutheran Church in America and the Lutheran Church-Missouri Synod.
4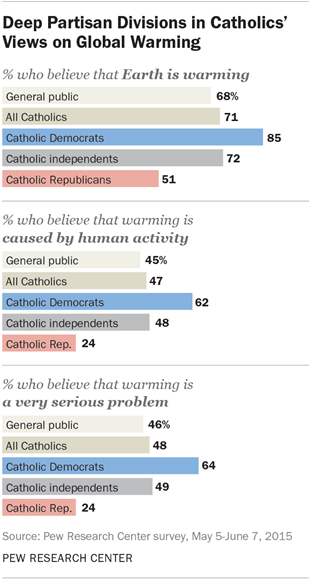 Before Pope Francis’ encyclical on the environment was published in June,U.S. Catholics’ views of climate change mirrored those of Americans overall – including major partisan divisions. While six-in-ten Catholic Democrats say global warming is caused by humans and that it is a very serious problem, only about a quarter of Catholic Republicans feel the same way.
5In a typical week, about one-in-five Americans share their faith online. This is about the same as the number who tune in to religious talk radio, watch religious TV programs or listen to Christian rock music.
6Americans have continued to become more supportive of same-sex marriage. Aggregated data from 2015 polls show that fully 55% of U.S. adults favor same-sex marriage, which is now legal nationwide following a Supreme Court ruling in June. That represents a rise of 20 percentage points over the last decade or so. Among the major religious groups, White evangelical Protestants are the least supportive of gay marriage (24%), while those without any religious affiliation are the most likely to favor allowing gays and lesbians to wed (82%).
7Religious freedom or discrimination? A 2014 poll found Americans are divided on the question of whether wedding-related businesses should be allowed to refuse service to same-sex couples for religious reasons, with 47% saying businesses should be able to refuse service and 49% saying establishments should be required to serve same-sex couples.
8On another hotly debated social issue – abortion – Americans’ views in the last two decades have largely held steady. A majority of U.S. adults (55%) continue to say abortion should be legal in all or most cases. At the same time, four-in-ten say it should be illegal in all or most cases.
9Frequency of religious service attendance remains a strong predictor of how people will vote in elections. In the 2014 midterm elections, exit polls showed that those who attend worship services at least weekly voted for Republicans over Democrats for the House of Representatives by a 58%-to-40% margin. Meanwhile, those who never attend services leaned heavily toward Democrats (62% vs. 36%).
10Christians continue to make up an overwhelming majority of members of Congress (92%), compared with 71% of the general public (as of 2014). At the same time, while 23% of U.S. adults are religiously unaffiliated, only one member of Congress (Rep. Kyrsten Sinema, D-Ariz.), or 0.2% of that body, claims no religious affiliation.
This is about as broad as it could be Christian 70.6% vs Non-Christian Faiths 5.9% (of which specifically Muslims are some ~1%)
This is about as broad as it could be Christian 70.6% vs Non-Christian Faiths 5.9% (of which specifically Muslims are some ~1%) Ricky Grimsley Dan Irving I believe that namely the relaxed-fit theory that the church does not need to be prepared to meet Christ in the imminent Rapture has caused the church to feel way too comfortable in this world and developing NAR-like theologies how to overtake it without a physical Christ or a literal Heaven.
Hence the state of the church in America TODAY – a relaxed-fit theology that comforts the church until the world overwhelms it BUT
This world is not my home I’m just a passing through
My treasures are laid up somewhere beyond the blue
The angels beckon me from heaven’s open door
And I can’t feel at home in this world anymore…
https://www.youtube.com/watch?v=CdOOxuQii_s